|
Brian Callahan
ME 590
for Prof. Steven Ceccio
and Dr. Stuart Cohen
University of Michigan, Ann Arbor
8/18/97
An Inertial Dynamometer and Radio Telemetry System
for High Speed, Glow Ignition, Two-Stroke Racing Engines
Abstract
An inertial dynamometer was built to measure torque
and power output from small, high speed, two stroke, glow ignition,
racing model marine engines. A discussion of system construction
is presented, along with sample measurements. A radio telemetry
system was built to measure engine speed during actual on-water
operation, for comparison to bench measured power characteristics.
Sample telemetry results are also presented.
Introduction:
Nitromethane / methanol fueled, two stroke, glow
ignition engines power radio controlled high speed model race
boats.

Figure 1: A Roadrunner 11cc Hydroplane turning
at 6.7g's
Previously, little was known about the engine speed
behavior during racing situations. Overall hull lengths shorter
than 1m, weights less than 2.5 kg, sustained accelerations greater
than 6 g's, a corrosive marine environment, intense vibration,
and unknown propeller characterizations have prevented even the
simplest data acquisition. In addition, engine speeds in excess
of 32,000 revolutions per minute, sensitivity to small torque
loads, and unavailability of gear reduction units have prevented
thorough characterization of engine performance.
This project intended to solve these problems with
the introduction of a small, high speed inertial dynamometer and
a small, lightweight radio telemetry system. The dynamometer
was designed to measure torque at engine speeds and velocity transients
similar to actual operation. The telemetry system was designed
to transmit engine performance data from an operating vehicle
to a data acquisition system on shore with minimal impact on hull
dynamics.
Inertial Dynamometer
It is possible to calculate engine torque and power
by allowing it to accelerate a known inertial load, measuring
instantaneous acceleration, and mapping the results back onto
the corresponding engine speed [1]. The dynamometer built fit
onto an aluminum frame 1m X 1m. The frame provided a structure
for attaching the engine, the inertia wheel support bearings,
a safety scattershield in case of wheel rupture or disconnection,
support for the driveshaft, a fuel tank mount, and engine water
cooling lines.
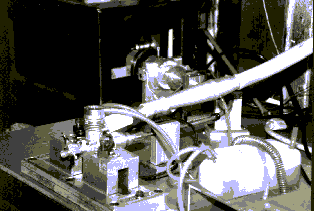
Figure 2: The complete dynamometer
A steel disk provided inertial load, a wound cable
delivered engine power from the crankshaft to the load, a one-way
clutch pressed into the load prevented cable damage and allowed
engine coast-down, a servo controlled the throttle and provided
means for a rev limiter, and a computer data acquisition hardware
and software system captured the data, reported results, controlled
the servo during rev limiting operation, and provided a user interface.
The dynamometer was designed to handle engines displacing
3.5, 7.5, 11, and 15cc with shaft speeds up to 33,000 revolutions
per minute on the 3.5's, and power levels up to 5.2 kW on the
15cc engines. The inertia wheels were designed to simulate engine
accelerations ranging from 5,000 to 10,000 rpm/sec.
Inertia Disk Design
To accurately simulate velocity transients similar
to actual racing conditions, several inertia disks were designed
to match a variety of engine and hull combinations (See Figure
3).
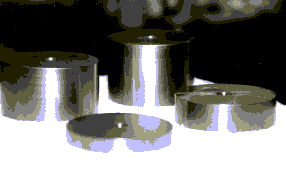
Figure 3: Inertia disks
The choice of a thick cylinder provided a geometry
convenient for calculating rotational inertia, easy machining,
and minimum air drag. Readily available 4140 steel served as
a suitable material due to its machineability, high density, and
high tensile strength. Preventing burst failure dictated a diameter
that kept tip velocity lower than 150 m/s at the particular engine's
maximum speed.
Wound Cable Drive Shaft and One-Way Clutch
To accommodate steady state loading necessary for
engine tuning and break-in, the inertia wheel was replaced by
a choice of large diameter, accurately machined fan blades, each
accurately machined to provide a suitable load for the particular
engine, speed, and load condition. To package these blades, the
dynamometer output shaft needed to extend off the end of the bench,
and perpendicular to the engine mount (see Figure 2). A wound
cable housed in a brass tube allowed engine power to travel through
the 90 degree turn. This also had the beneficial side effect
of accurately simulating drivetrain losses in the boats, since
they use identical components.
Unfortunately, a wound cable is capable of resisting
torque in one direction only, while the inertia wheel resists
both acceleration and deceleration. Any time the inertia wheel
overran the engine, even for a brief moment, the cable failed
(see Figure 4).
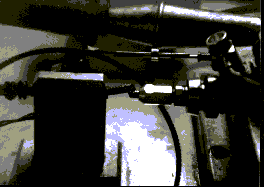
Figure 4: Cable failure due to reverse torque
A one-way roller clutch pressed into each inertia
wheel allowed overrun without imparting any reverse torque. The
clutch also allowed the engine to coast back to idle after each
test, which helped prevent scuffing damage in case of a fuel lean
condition during closed throttle operation. During initial testing,
the clutch rollers tended to brinnell the output shaft, which
lead to catastrophic clutch slippage in a matter of two runs.
Precisely machining the output shaft diameter to the clutch manufacturer's
specifications, switching to 8620 alloy steel, and case hardening
to a minimum of 58 Rockwell C prevented any more impact damage.
Rev Limiter and Throttle Control
Flame ignition in these engine is accomplished by
a passive glow plug element. Since there is no control mechanism
to turn off the ignition, the engine will continue to accelerate
unless the intake or exhaust is throttled, the fuel flow stops,
or the resistive load increases to match the excess torque. If
left unloaded, some of the engines will reach a speed high enough
for mechanical failure.
Since the inertia wheel and bearings were designed
to have a minimum air drag and friction resistance, they can supply
little resistive torque at small accelerations.
Resistive torque, 
Also, the resistive torque is independent of rotational
speed. Therefore, the inertia wheel will not stop the engine
from climbing to mechanical failure.
To prevent engine damage from excessive speed, an
electronic throttle control was built. A standard, high-speed
servo similar to the boats' on-board throttle control governs
the throttle setting (see Figure5).
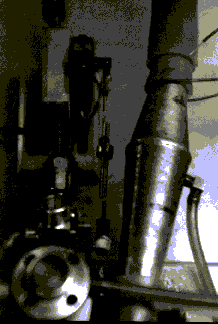
Figure 5: Servo control mounted to the engine
throttle
A solid state circuit took as input a potentiometer
voltage from a hand control (see Figure 6), and a digital input
from the computer data acquisition board. Under normal operation,
the manual control operates the servo. But, if the monitoring
software in the computer notices that the engine is above a prescribed
limit, it signals the digital input, and a comparator circuit
commands the servo to an idle position.
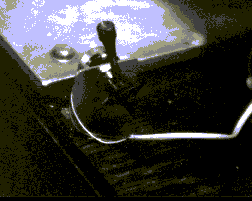
Figure 6: Manual throttle control potentiometer
Data Acquisition Hardware and Control Software
An aluminum disk swinging through an optical coupler
to generated a square wave signal with frequency proportional
to engine speed. A National Instruments 1200AI board with the
5B37 thermocouple module and frequency-to-voltage converter installed
in an IBM style Pentium 90 computer provided a robust data acquisition
system.
The software took as input only the engine speed
voltage. It calculated instantaneous acceleration at each time
step, and monitored the rev limit control. The user interface
allowed the operator to choose the specific inertia value for
the chosen wheel, prescribe a rev limit, input the engine bore
and stroke, manipulate the output graphs for convenient examination,
and record test notes. It reported torque and power at every
rpm, magnitude and position of the torque and power peaks, and
maximum Brake Mean Effective Pressure.
Since calculating acceleration involved taking the
first derivative of the speed signal, the calculations were highly
sensitive to noise [2]. Initial testing produced results with
signal-to-noise ratio of almost 1:1. Switching from software timed
to hardware timed acquisition, reserving all calculations for
post processing, and adding a software simulated low-pass filter
with carefully chosen coefficients allowed noise free, yet highly
accurate results.
Test Method
The engine accelerates at maximum power, until the
software notices max rpm, signals the servo controller to bring
the engine to idle, ends data acquisition, begins calculations,
and reports results.
Meanwhile, the engine slows to idle, and the inertia
wheel overruns on its one-way clutch.
Once the software has reported results (less than
100msec), it continues controlling engine speed in a closed loop
with hysteresis.
- For the next test, hold a steady idle, brake
the wheel, and start again.
In this fashion, the dynamometer operators can complete
several tests per minute, with the complete performance characteristic
displayed real-time.
Sample Dynamometer Results
The Results in Figure 7 show a sample dynamometer
run on an 11cc Picco EXR engine intended for a lightweight hydroplane
hull. The inertia wheel chosen approximated 8000 rpm/sec engine
rise. This engine developed excellent torque and power.
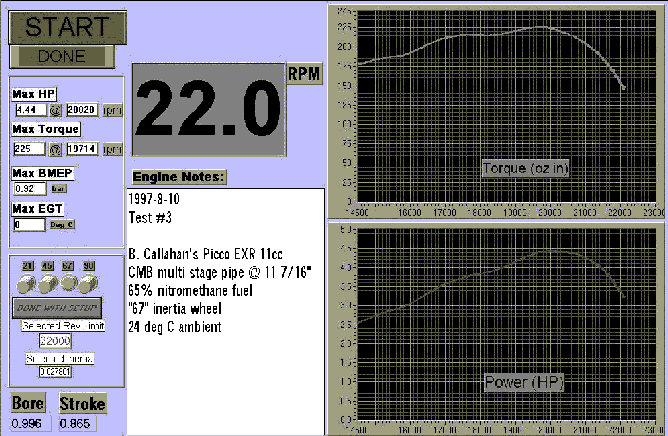
Figure 7: Sample dynamometer user interface, with
sample test results
Radio Telemetry System
The same trigger wheel and optical coupler from the
dynamometer served as the engine speed detector. The signal was
transmitted to shore using a battery powered Frequency Modulated
transmitter. On shore, a radio receiver demodulated the signal,
and the same frequency-to-voltage converter from the dynamometer
sampled the data.
The entire on-board system weighed less than 75g,
which is suitable for even the lightest of hulls.
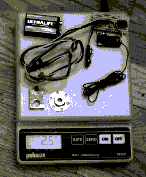
Figure 8: The complete on-board radio telemetry
system
Sample Telemetry Results
Shown in Table 1 are results from an on-water test
with the same engine that produced the results in Figure 7, in
the 3.5 kg hull pictured in Figure 1.
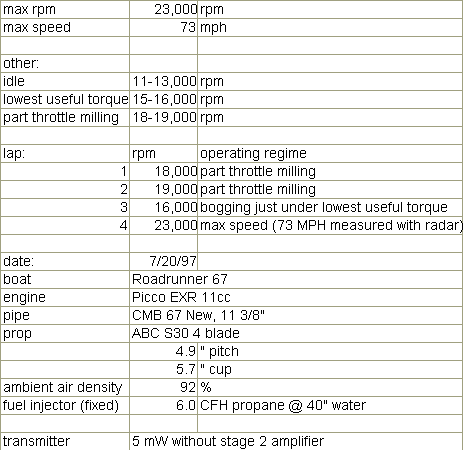
Table 1: Sample Telemetry Results
Conclusions
Once discovered, the complete power versus engine
speed behavior, coupled with the on-water engine speed measurements,
will quickly enhance engine performance development. The tools
built during this project will also be useful for vehicle dynamics
improvement, engine durability development, and driving method
enhancements.
An entire test takes less than five seconds to complete.
Compared to other test stands which employ steady state measurements,
this method is much less taxing on the test engine. Since the
stand is intended to test hundreds of engines each year, this
can represent much saved cost in otherwise destroyed engines.
Recommendations for Future Development
Increasing the radio telemetry's range to fully encompass
the standard 1/6 mile racing course will allow much information
about hull and engine dynamics. Especially important is measuring
actual engine acceleration, so that the dynamometer's inertia
wheel can be precisely matched to each hull and engine combination.
Continued engine testing will highlight specific
characteristics of the dynamometer operation. For example, sensitivity
to engine temperature during the test can be an important factor
[1].
Measuring exhaust gas temperatures during the runs
is critical for exhaust chamber development. A thin, low time
constant thermocouple needs to be employed to capture the temperature
during the short run.
Adding an exhaust pressure transducer could also
aid exhaust chamber and exhaust port design. Unfortunately, the
necessary sampling rates in excess of 50 kHz will make this challenging.
Acknowledgements
The author wishes to acknowledge the contributions
of each of the MWD and Associates team: Marten Davis for his hospitality,
financial contribution and use of his engines, John Ackerman for
his engine expertise and use of his shop facility, Norris Sparks
for his machining labor and expertise and use of his engines also,
Joe Kramer for his power supplies, and Bobby Coleman for all those
barbecued ribs.
References
[1] Kee, Robert J., Blair, Gordon P., Acceleration
Test Method for a High Performance Two-Stroke Racing Engine,
SAE Motor Sports Engineering Conference Proceedings Dearborn,
Michigan, December 5-8, 1994. SAE paper 942478
[2] Tang, Liang, Signal Processing Question. Personal
interview (21 June 1997).
|